中美贸易摩擦,相互开出巨额关税惩罚清单,引发全球广泛关注。贸易摩擦没有赢家,美国布鲁金斯学会发布研究报告,从美国角度详细分析了美方可能受到影响的产业及受损程度。现将全文编译刊发,以飨读者。

中国与特朗普政府针锋相对,相互威胁向对方采取关税惩罚措施,这已引发全球关注。贸易专家、外交官和新闻机构争相对这两个世界上最大的经济体所表现出来的姿态发表看法。一些看似重大而遥远的议题正在现实中逐步浮现。
针对特朗普政府此前对中国出口产品的关税威胁,中国政府迅速回应,也列出两份针对美国关税的加征清单,涉及到上百种美国出口产品。这可能进一步引发特朗普政府新的制裁威胁,美国人即将感受到这场对峙不再只是遥远的凶兆。
贸易政策往往被认为是离普通老百姓比较遥远的国际问题。然而,当中国针对美国生产的具体产品——从西洋参到飞机——加征关税时,华盛顿和北京高层的姿态瞬间变得如此真切。
为了观察贸易摩擦对美国各地的具体影响,我们分析了可能受到中国两轮关税威胁影响的美国产业和地区的风险情况。我们首先罗列出一份清单,涉及234种中国拟加征关税美国产品所处的相关行业。这份清单正是中国回应美国威胁对从中国进口的钢铝产品和大约1300种其他商品加税的报复性行为。接着,我们考察了美国这些行业的就业情况,以衡量美国各产业门类和各地方遇到潜在贸易摩擦时可能受到的影响和脆弱性。这一细致的、自下而上的描述,一定程度上也显示了美国产业的地理分布结构。
初始分析表明,尽管全面贸易摩擦对美国整体工作岗位数量的潜在影响不太严重,但中国反击清单中包含了一份涉及多个行业,显然经过精心挑选的“名单”,并依照美国产业分布情况作了周密谋划,不论支持共和党和民主党的地区都会感到恐惧。
我们总共统计出40个可能受到加征关税政策打击的行业,涉及近210万个工作岗位,进而列出这些行业受影响的岗位类型和数量。下面是我们列出的行业清单:

(表1)
从表1中可以看出,涉及的行业包括规模较大的工业企业,如塑料制造、飞机制造及汽车、轻型汽车、卡车、房车生产(2016年分别提供30万、23万和20万个岗位),包括玉米种植(1.8万个岗位)、大豆种植(5千个岗位)、生猪饲养和屠宰(14.7万个岗位)等农业部门支柱,也包括水果和坚果生产(18.7万个岗位)、葡萄酒庄(6万个岗位)和酿酒厂(1.2万个岗位)等特色行业。
总的说来,这份清单表明,中国的贸易官员似乎比美国的贸易官员对美国各种产业的分布和影响力有更深的理解。他们的清单包含了高技术含量、低技术含量、工业及农业、普通商品和特殊商品等各种产业。
在了解可能受威胁的岗位同时,我们也发现中国在美国产业的地理分布结构及美国不同政治观点支持者的地理分布方面做了功课。
为了说明这一点,我们绘制了全国每个县中40个可能受影响行业涉及的岗位情况的地图(受影响的岗位在当地总岗位中的占比),结果如下:
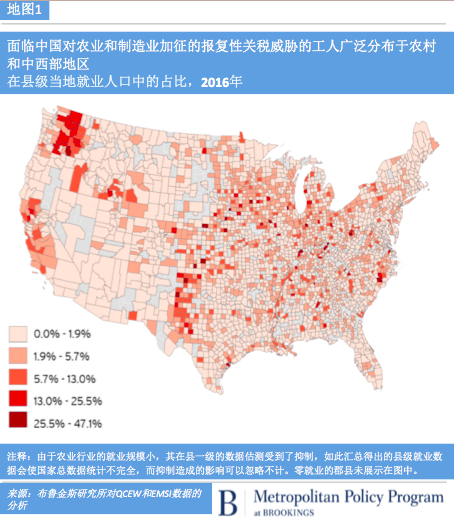
从上图中可以立刻发现,美国产业体系就业分布状况完全暴露在中国的关税攻击之下。
以中西部和上南部65号州际公路沿线的汽车、多用途汽车(SUV)和野营车(RV)装配厂为代表的制造业传统中心地带受影响显著。同样的,主要生产玉米和大豆的中西部县、依赖生猪养殖产业的中西部和南部的一些县受影响也很明显。
然而,暴露在关税打击下的阴影区域大大超出了一般的工厂农业和商品农业领域,扩展到其他领域。加利福尼亚尽管远离中西部的工厂带,也因纳帕谷葡萄酒和中央谷地的蔬菜、水果和浆果种植,以及洛杉矶塑料产业,受到潜在加税的严重影响。类似的,西北部果农和坚果种植县及华盛顿州的斯诺霍米什县(仅波音公司就在该县有3.8万个飞机制造工作岗位),也暴露在加税威胁之下。同样值得注意的是城市和城郊地区,位于印第安纳州中部的马里恩县和费城附近的蒙哥马利县也因大规模的制药业而受到影响。
下面这幅地图,专门展示了可能受影响的就业集中区域,突出了城市和边远西部地区暴露在中国关税反制中的工人就业情况:
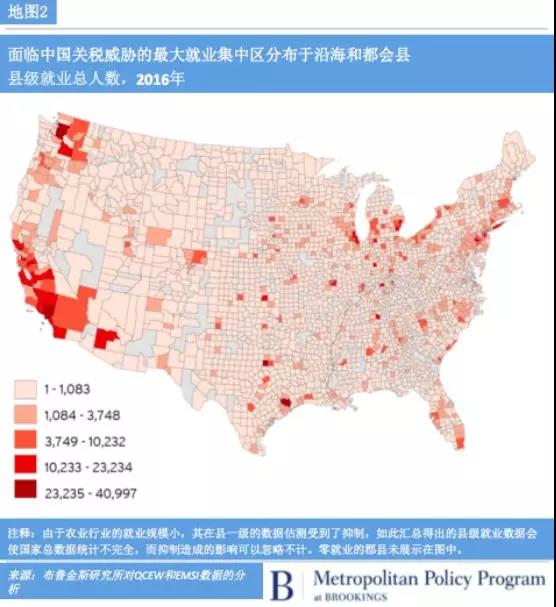
上图展示了受影响行业的绝对岗位量。根据该图,大城市出口中心区域,以及同中国贸易往来频繁的西海岸各州受影响最大。西海岸地区受影响行业集中在飞机、制药、水果和蔬菜产业。
针对中美贸易摩擦对美国就业分布的影响,有几点值得一提。首先,正如我们先前在谈论更普遍的贸易依赖关系时所说的那样,关于美国暴露在关税问题面前的风险地图清楚地表明,虽然任何“贸易摩擦”最初都可能呈现为一种抽象的地缘政治问题,但这种特别的贸易争端最终将牵涉到地方和区域的经济和就业——并且可能带来意想不到的后果。我们此前曾说过,“贸易牵涉到数百个具体地区的数百万名工人,他们通常是驱动当地贸易的关键力量”。这意味着:任何即将到来的贸易摩擦都离本地社区并不遥远,而各个社区不太可能会对任何潜在的混乱保持缄默。
这就带来了政治问题。我们观察到的数据及其分布显示,看上去受影响的区域和不受影响的区域,并不以政治观念分野,中国的加税清单似乎旨在确保美国几乎所有地区最大程度地受到贸易摩擦的影响。
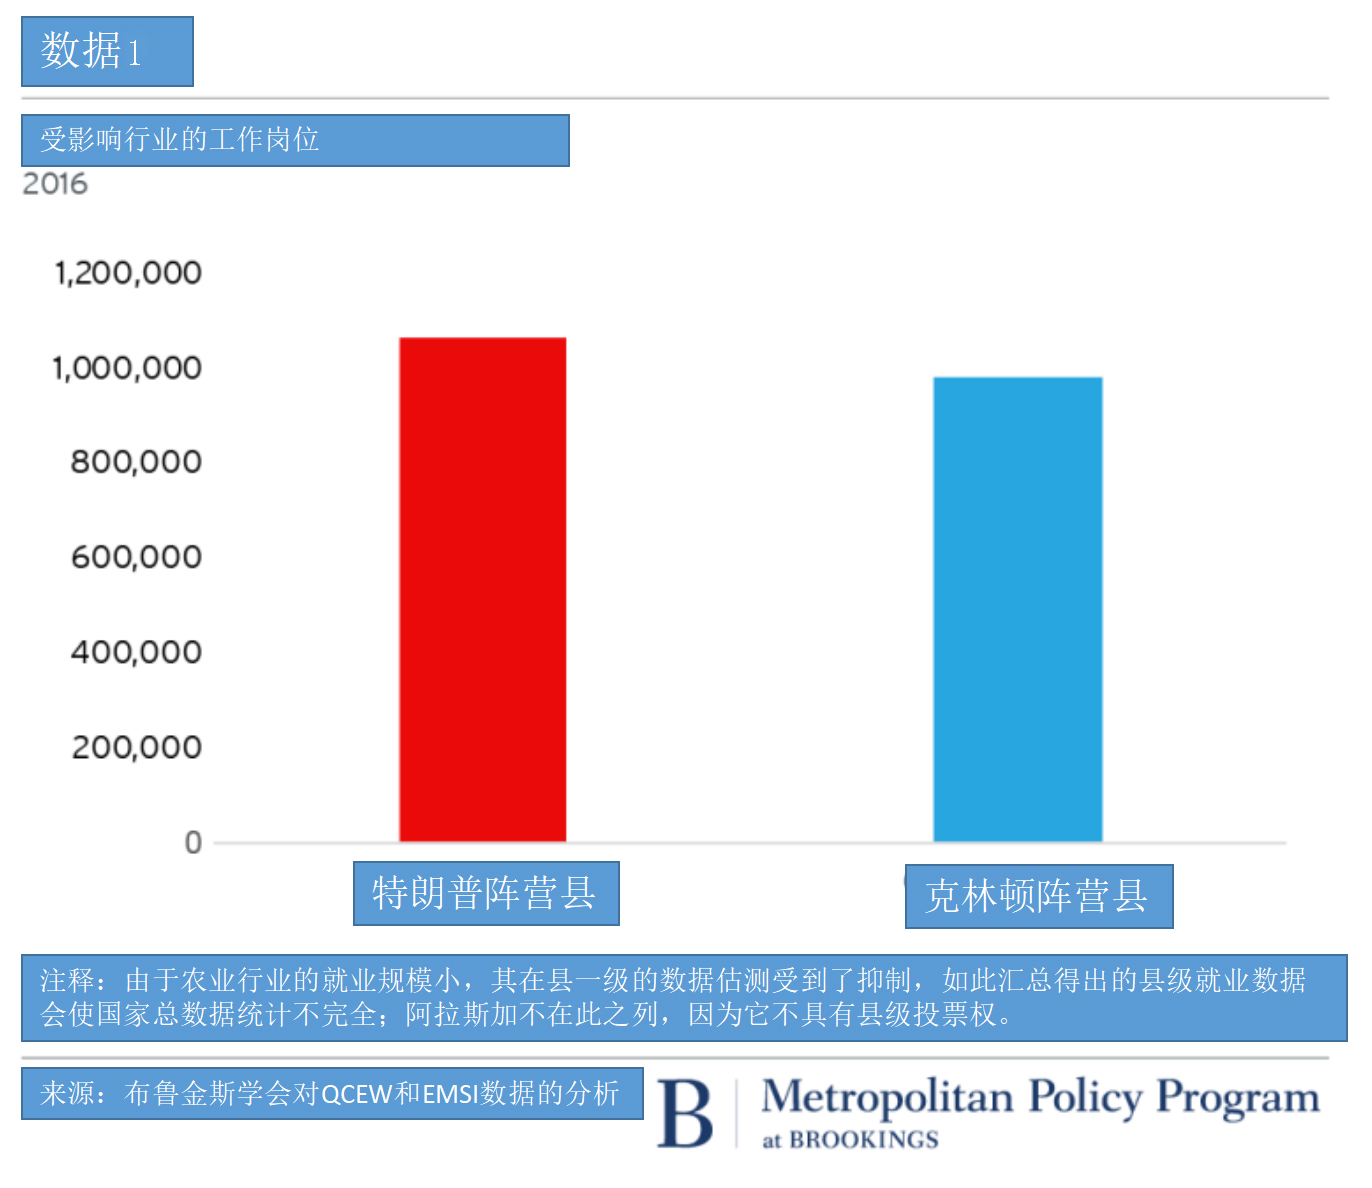
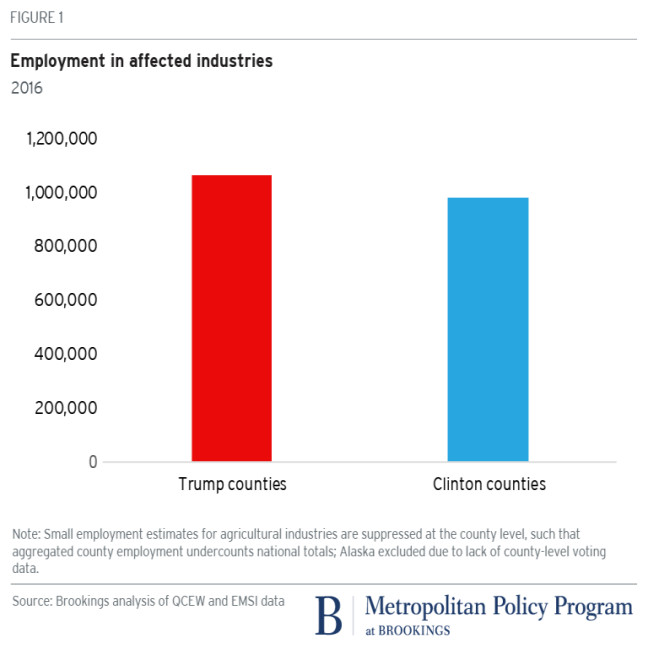
一方面,210余万个可能受到关税政策影响的工作岗位几乎是在2016年大选时特朗普总统和希拉里获胜的县之间均匀分布。以政治态度划线的话,我们估计大约有106.2万个受波及的工作岗位(52%)在支持共和党的县,97.6万个在支持民主党的县。这意味着无论是共和党州还是民主党州的国会议员,均会因贸易摩擦对峙而卷入其中。
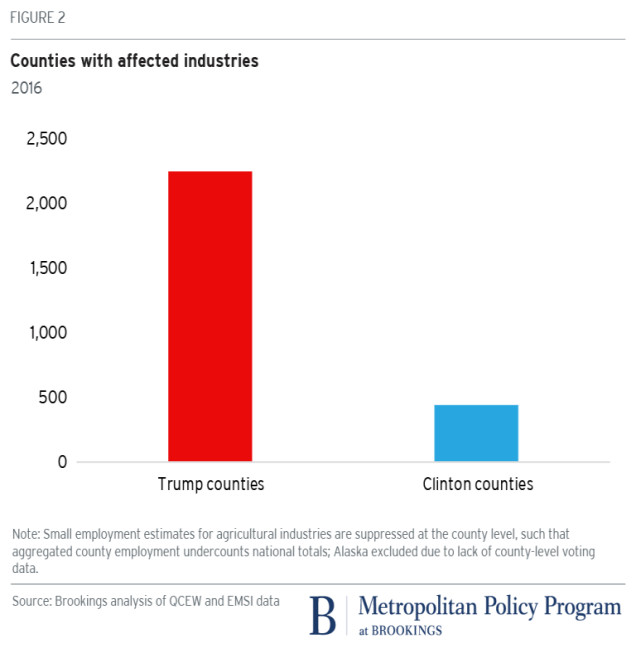
但另一方面,中国的关税清单似乎更主要的目的是搅动特朗普总统的红色州基地。毕竟,在行业的就业受到中国当前关税政策潜在影响的2742个县中,有2247个(82%)在2016年大选中投票支持了特朗普,而只有439个(18%)支持了希拉里。
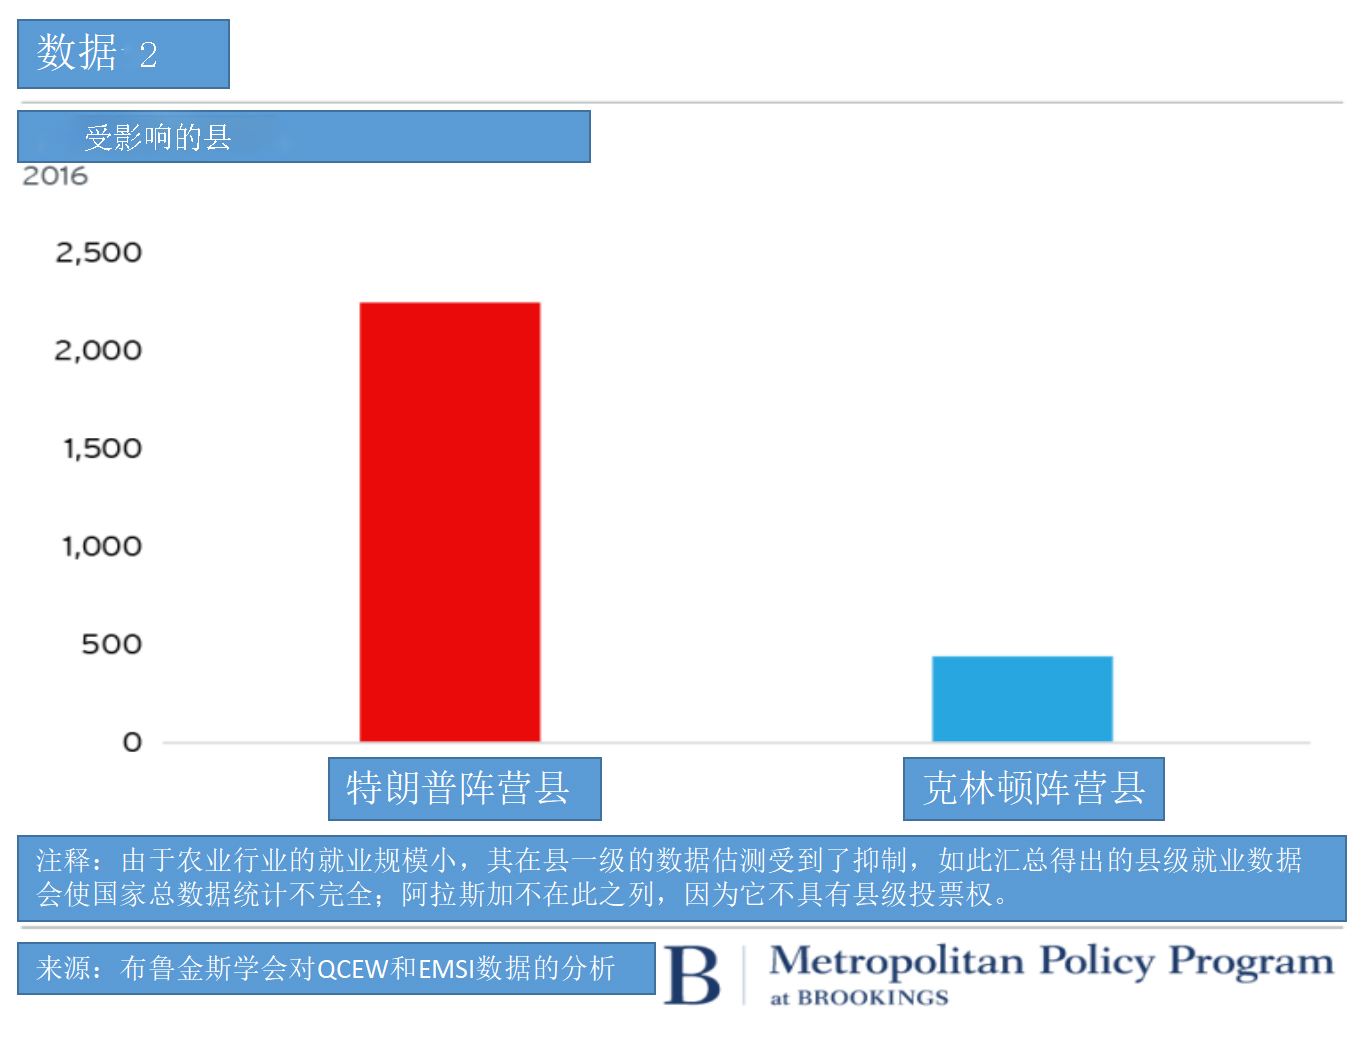
简言之,虽然蓝色州的民主党主要担心贸易摩擦对华盛顿州的航空航天行业及新泽西州的医药制造业带来的威胁,但红色州的共和党参议员和众议员——他们大部分人一直都是自由贸易的支持者——却几乎全部都会受到困扰。
无论如何,关税影响地图表明中国官员对美国贸易风险的地理分布有着一股敏锐的感觉,并且正在按下“政策打击”按钮,以确保美国的政治体系对政府政策形成反制。
与此同时,特朗普政府对延续贸易摩擦的僵持抱有明显强硬的态度,这必然使得未来数月全球经济面临最大限度的不确定性。
但地图的暗示更加明了:特朗普总统发动的贸易行动不再只是纸上谈兵,很快就会对现实中地方经济体的实体岗位产生真切的影响。
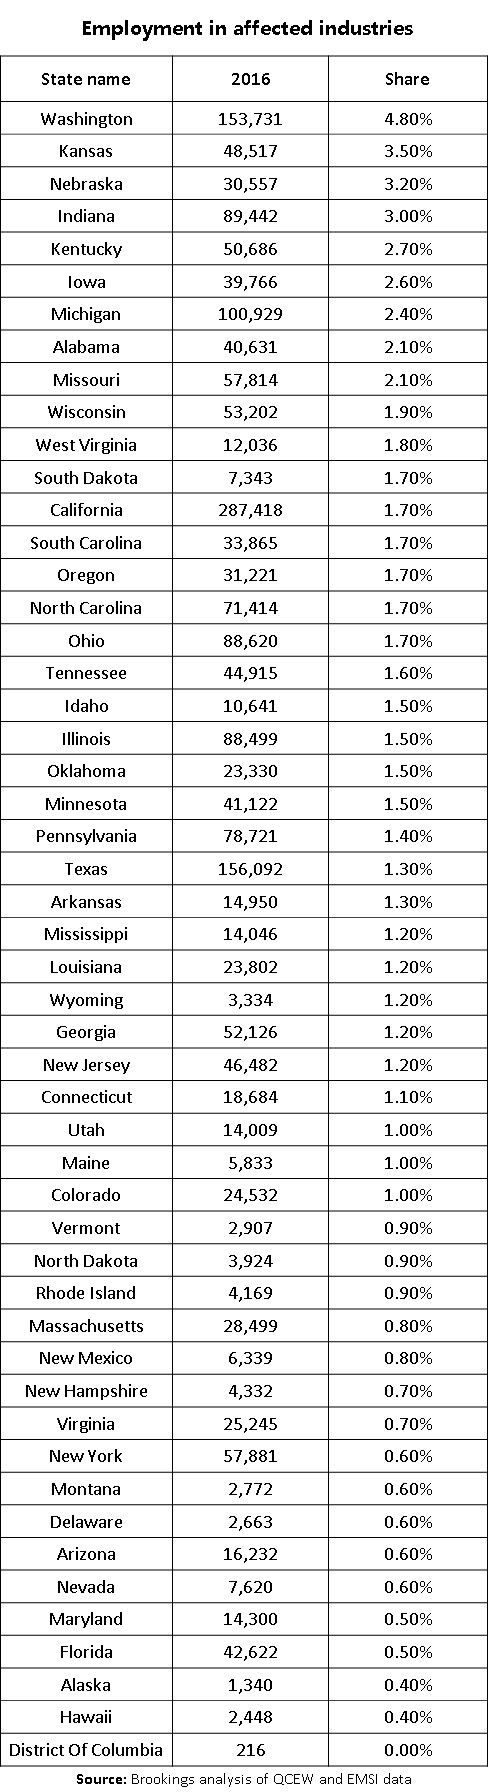
下表为各个特定州(县)中绝对受关税风险影响的就业岗位和就业份额:
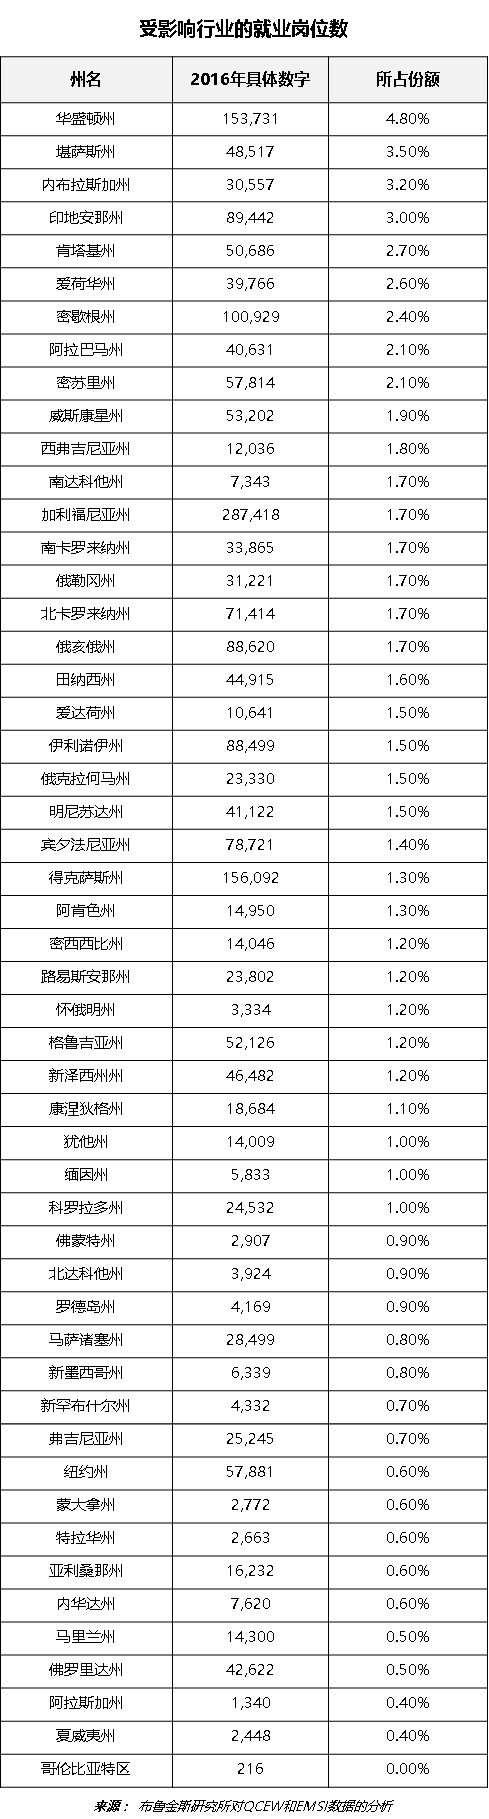
数据表明:EMSI(译者注:经济建模专家国际公司Economic Modeling Specialists International,简称EMSI)数据不适用于样本较为精细化的农业类行业。我们为此使用了BLS的QCEW调查,但由于这些行业的就业规模较小,许多县一级的数据估测受到了限制,通常有超过半数以上的数据没法归属于任何特定的地理区域。这意味着对这些行业的县级数据进行汇总时,数据值往往会遭严重低估。然而,如果这些数据在县一级数据层面体现不足而评估受限,也就意味着它们所占当地就业份额可忽略不计。
在所有受影响的行业中,有9750个工作岗位EMSI 没有分配给各州的任何特定县。
由于前面所提及的两个问题,在所有40个受影响的行业中,有51098个工作岗位我们无法分配给任何特定的县。

How China’s proposed tariffs could affect U.S. workers and industries
The Trump administration’s tit-for-tat with Beijing over potential tariffs has captivated global audiences. Trade experts, diplomats, and news organizations are all fulminating about the high-level performance art being played out by the world’s two largest economies. Gigantic, distant agendas are taking shape.
Yet for all that is remote and portentous about the standoff, China’s lightning-bolt announcements last week with two lists of proposed tariffs on hundreds of American goods—responding to and then precipitating new threats from the Trump administration—had the ancillary effect of bringing the far-away global down to the local.
Trade diplomacy can often seem an international and faraway activity. However, when it comes down to specific lists of proposed tariffs on particular products that Americans produce, from ginseng to airplanes, the high-level posturing of Washington and Beijing suddenly gets more real.
To observe the local effects, therefore, we analyzed the exposure of U.S. industries and places to potential disruption from the two rounds of threatened Chinese tariffs. To do this, we first created a list of the 40 U.S. industries that produce the 234 products listed by China for potential tariffs in retaliation to both general U.S. steel and aluminum tariffs and specific American tariffs on some 1,300 Chinese goods. We then checked their national and county-by-county employment as a way of gauging industry and local vulnerability to potential trade gyrations. In this fashion, we’ve sketched a granular, bottom-up look at industries’ and locations’ exposure to Chinese saber-rattling, which in turn provides a revealing look at the geography of U.S. production.
What do our tables and maps show? Our top line estimates suggest while the total number of jobs potentially disrupted by an all-out trade war remains modest, the count encompasses a diverse and shrewdly chosen “hit list” of hallmark American industries—one that appears well-calculated to scare both red and blue America.
Altogether, we count some 2.1 million jobs in the 40 industries that produce products now slated for possible tariffs, and see a wide variation in the type and number of exposed jobs in those industries. Here’s a look at the industry list:
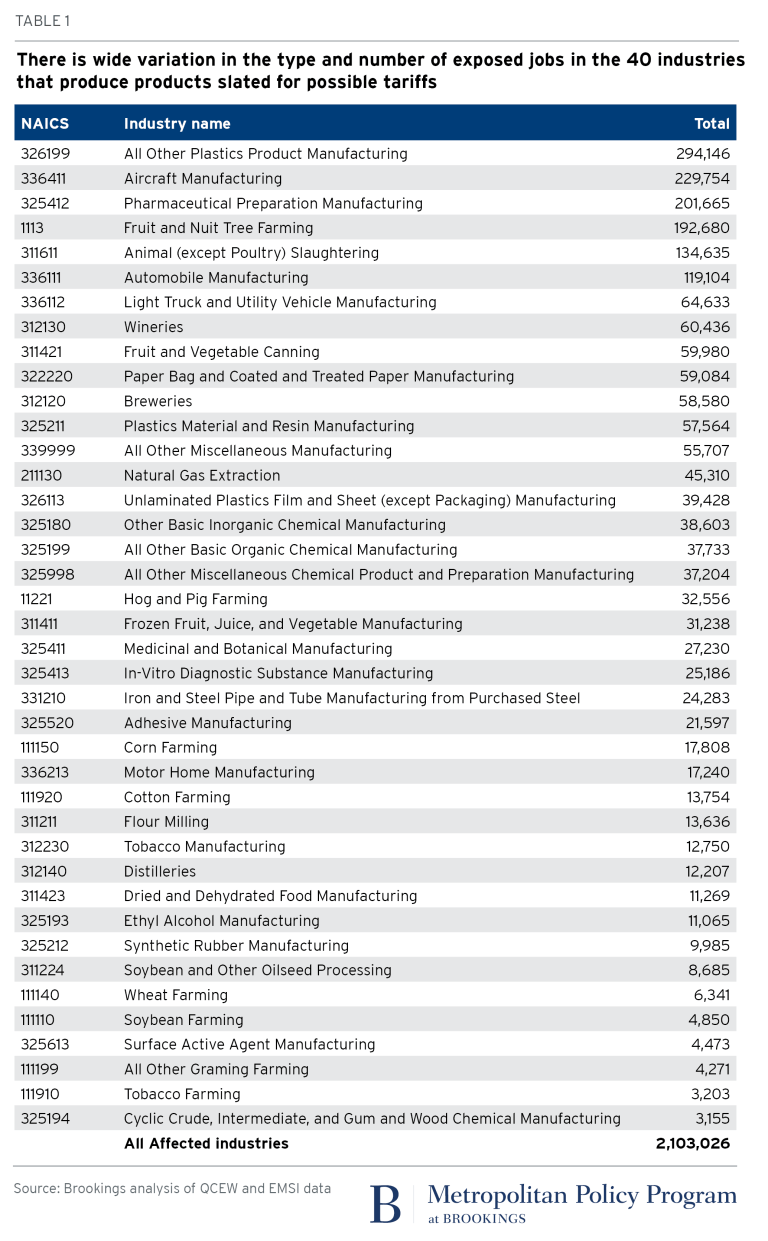
Scan the list and it ranges from sizable industrial enterprises such as plastics manufacturing, aircraft manufacturing, and automotive/light/truck/motor home production (300,000, 230,000, and 200,000 direct jobs respectively, in 2016); to farm-sector mainstays like corn (18,000 jobs), soybeans (5,000 positions), and hog production and slaughter (147,000 workers); and into specialty industries such as fruit and nut production (187,000 workers), wineries (60,000 workers), and distilleries (12,000 positions).
Overall, the list suggests that Chinese trade bureaucrats have as good, or perhaps even better, of a feel for the diverse and culturally significant key elements that comprise the U.S. production base than their U.S. counterparts. High-tech and low-tech, industrial and agricultural, commodity and specialty production are all represented and put into play.
Map the potentially affected jobs, meanwhile, and it’s very clear that the Chinese have done their homework about the geography of both the U.S. production system and its divided politics.
To confirm this, we mapped the county-by-county location of employment in the 40 potentially affected industries (as a share of the local total); here are the results:
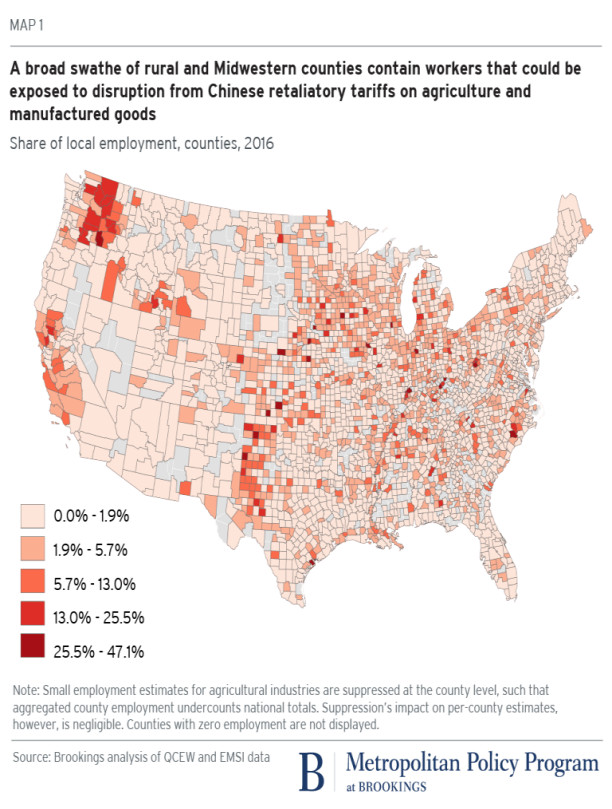
Right off, you can see that the local map of exposure to China’s potential tariffs amounts to a bird’s-eye view of how diverse and widely distributed is the American production system.
Immediately the classic heartland manufacturing base jumps out, anchored by auto, SUV, and RV assembly plants in the Midwest and upper South along Interstate 65. Likewise, the familiar Midwestern agricultural complex is visible, with counties dedicated to corn and soybeans, and led by the highly visible rural counties in the Midwest and South that are dominated by slaughter houses.
And yet, the shaded areas of tariff exposure extend way beyond the usual factory and commodity agriculture domain into other realms. Far from the Midwestern factory belt, California is heavily affected by the potential tariffs with Napa Valley wines; Central Valley vegetables, fruit, and berry growers; and Los Angeles plastics. Similarly, rural fruit- and nut-growing counties of the Northwest stand out as exposed as does Snohomish County, Wash., with its 38,000 aircraft manufacturing jobs mostly at Boeing. Also informative is the importance of urban and suburban places, such as Marion County in central Indiana and Montgomery County near Philadelphia, that are involved in the sizable pharmaceutical manufacturing industry.
Indeed, a look at a new map focused on concentrations of potentially affected employment underscores the urban and Far Western cast of worker exposure to potential future China gyrations:
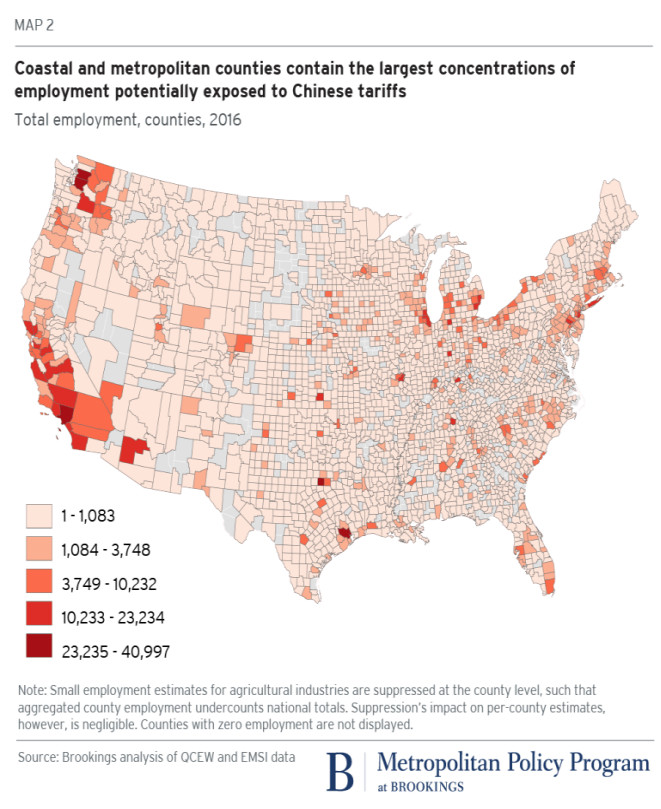
Less far flung than the map of local shares, the map of absolute totals especially highlights a mix of big-city metro export hubs that were discussed here as well as the heavy China trade of the Pacific Coast states, anchored by aircraft, pharma, fruit, and vegetables production.
As to what these patterns say about the current trade skirmishing, a few points are relevant. For one thing, as several of us have said before about trade reliance more generally, the map of U.S. tariff exposure makes clear that while any “trade war” may be entered as a matter of abstract geopolitics, its particular battles will ultimately involve local and regional economies and jobs—with potentially unexpected ramifications. As we wrote before, “trade involves millions of workers in hundreds of real and varied places, and often drives crucial local commerce.” The implication: any coming trade wars will not be remote from America’s local communities, which will likely not remain silent about their views of any potential dislocation.
Which brings up the matter of politics. Here, the data and its geography—likely intentional—seem to guarantee that no clean political divide separates tariff-affected counties from others. Instead, the Chinese tariff lists seem designed to ensure that both parties—and virtually all parts of the country—are maximally disturbed by the ongoing saber-rattling. On the one hand, the 2.1 million potentially tariff-affected jobs are almost evenly distributed in counties that President Trump and Hillary Clinton won in the 2016 election. Along those lines we estimate that some 1,062,000 of the exposed jobs (52 percent of them) lie in red counties and 976,000 in blue counties. That means that both red state and blue state members of Congress will be activated by the faceoff.
Yet on the other hand, the Chinese tariff lists seem optimally designed to especially agitate President Trump’s red-state base. After all, of the 2,742 counties with employment in the industries potentially impacted by the current Chinese tariffs, 2,247 (82 percent) of those counties voted for Trump in 2016, while just 439 (18 percent) supported Clinton.
The upshot: Although select blue-state Democrats will be concerned about threats to aerospace jobs in Washington and pharmaceutical manufacturing jobs in New Jersey and Minnesota, red-state Republican senators and representatives, many of whom have long been proponents of freer trade, must almost all be getting nervous.
In any event, the tariff-impacts map suggests Chinese officials have a canny feel for the geography of U.S. trade exposure and are pushing buttons that ensure the U.S. political system mobilizes pushback.
At the same time, the Trump administration’s apparent seriousness about continuing the standoff guarantees maximum uncertainty for the global economy in the coming months.
In the meantime, however, the intimation of the map is simpler: President Trump’s actions on trade are no longer just talk; they could soon have real implications for real jobs in real local economies.
Here for state and county-specific absolute tariff-exposed employment and employment shares.
Data caveats:
EMSI data is not available for detailed agricultural industries. We have used the BLS's QCEW survey for these, but due to their small employment size, many county-level estimates have been suppressed, with often more than half of national employment not attributable to any particular geographic area. This means that aggregating the county data for these industries will lead to often substantial undercounting. Likewise, though, their small presence at the level of individual suppressed counties means they only account for a negligible share of local employment.
There is a residual of 9,750 jobs across all affected industries that EMSI does not assign to any particular county in each state.
Across all 40 affected industries, there are 51,098 jobs that due to the preceding two issues we are unable to assign to any particular county.

太和智库原创文章,转载请注明出处。
—————————————————
国以人兴,政以才治。太和智库,关注时代需要。
微信公众号:taihezhiku


© 2013-2021 Taihe Institute (TI) . All rights reserved. Taihe Institute (TI) . 太和智库咨询(北京)有限公司 京ICP备16023694号-1 法律顾问:中伦文德律师事务所

